
Matt D’Auria has updated the White House staff retention data beginning with Bill Clinton’s second term in 1997-1998 through the end the first year of Barack Obama’s presidency in 2009. Here’s a graph of his findings. Note that that these are based on White House staff listings in the U.S. Government Manual, and include only senior-level White House aides and their immediate assistants. The data do not include lower-level White House clerical staff. Nor, in contrast to the data I posted yesterday, does it include any cabinet members.
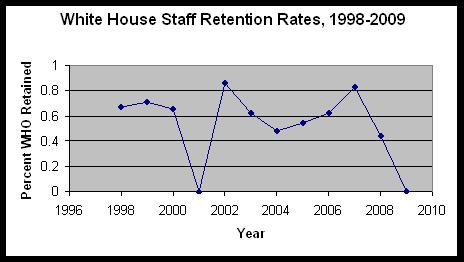
As you can see, the results are consistent with the post-1970 reform era retention patterns I discussed in yesterday’s post. Most noticeably, we see the familiar reduction in retention rates in the period 2003-04, as Bush begins to gear up for his reelection bid. I’ve not yet had the chance to integrate Matt’s data with the data compiled for the period 1929-1997 by Katie Dunn Tenpas and me, but here are the side by side averages for each year of the presidents’ terms during the three time periods: 1929-1970, 1971-1997, and the latest figures. (Keep in mind that the figures aren’t strictly comparable since the first two retention columns include cabinet members while the most recent one does not, in addition to differences in the number of years covered and electoral contexts.)
| Term Year | Pre-Reform 1929-70 | Post-Reform 1971-97 | 1998-2009 |
| Year 1 | .42 | .28 | .43. (.645 if 2000-01 and 2008-09 periods of complete turnover are excluded) |
| Year 2 | .86 | .75 | .72 |
| Year 3 | .82 | .64 | .72 |
| Year 4 | .83 | .71 | .52 |
Again, the important point is that retention rates within the White House staff continues to lag from the levels recorded prior to 1970-71, indicating a continuation of the higher rate of staff turnover characteristic of recent years. We see less of a dip from year 2 to 3 in the post-1997 data, but keep in mind that this includes retention rates from both Clinton’s and Bush’s second term, when neither president was gearing up for reelection. On the other hand, retention rates in year four of the presidents’ terms in this most recent dataset are lower than in the previous time periods. Although this partly reflects the exodus of Clinton’s aides in 1999-2000 and Bush’s in 2007-08 in anticipation of the end of both presidencies, it is also the case that the highest turnover in Bush’s White House staff occurred during the transition from his 3rd to 4rth year, as he moved into full reelection mode. (Reminder: the data indicate the percent of aides in the year listed who also served in the White House during the previous year. Note that because there’s a time lag between when the staff listings are submitted to the Government Printing Office and when the Manual comes out, and because the Manual spans calendar years, the demarcation in the data between yearly listings isn’t as neat as one might like. So, for example, the retention rate for 2002 below actually measures those in Bush’s White House staff as of sometime in late summer, 2002 who were also in the White House a year previous). With those caveats in mind, here are the retention rates for years 1-4 of Bush’s first term.
| 2001 | 0 |
| 2002 | 0.86 |
| 2003 | 0.625 |
| 2004 | 0.48 |
We see, then, that almost 40% of Bush’s White House staff serving in the late summer, 2002, were gone by the following year, and more than half of those working in the White House during the late summer, 2003 had left by the time the campaign was in full gear in 2004.
Several of you have wondered whether the higher turnover simply reflects increased levels of staff “burnout” in the modern era due to more stressful working conditions, rather than impact of reforms affecting presidential campaigning. When Dunn Tenpas and I estimated the impact of the changing presidential selection process on retention rates for the period 1929-1997, we controlled for each aide’s/cabinet secretary’s previous length of service. Even when accounting for previous time served, we still found a pattern in which turnover increased as a function of the post-reform electoral changes. So burnout is unlikely to be the only factor at work here.
If I can, I’ll try to update our statistical analysis for the post-1997 period. However, if the post-reform turnover pattern holds, by this time next year between 30%-40% of Obama’s current White House staff will be working elsewhere. Why? Because (with apologies to the immortal Bob Dylan): It’s time to start a-campaigning!